
Every developer compares mapping APIs the same way: Find the cheapest vendor and you control your mapping costs. It makes intuitive sense. But it's backwards.
The actual cost of a mapping integration is determined entirely by how your developers architect the API calls — which APIs are called, when, and how many times per user action. Two teams using identical Mapbox setups can have a 10x cost difference based on integration patterns alone.
Worse, the hidden cost structures in mapping APIs can negate any vendor savings entirely. Take Mapbox's August 2025 Search Box pricing increase combined with keystroke-level billing: if autocomplete requests aren't debounced, costs inflate 10–20x without any visible pricing change on the vendor's home page. The same vendor comparison tables that say "Mapbox is cheaper" can become wrong overnight.
We learned this the hard way building Gokada, a ride-sharing app in Nigeria. We didn't save 46% on monthly mapping costs by switching vendors. We saved it by mapping the request architecture first, choosing the right APIs, then comparing vendors.
Let's start with how to actually think about mapping API costs.
The industry standard for mapping API decisions (and why it's backwards)
If you've read a mapping API comparison before, you know the formula:
- Show a table of vendors and their per-1,000-request pricing
- Calculate which vendor costs less
- Conclude with "it depends on your use case"
This approach has dominated since Google raised prices 1,400% in 2018. It feels logical. But it measures the wrong thing.
Vendor pricing is a single input to your actual cost. It's not the dominant one. Here's what actually drives your monthly bill:
- Your request architecture — The specific combination of APIs you call (Geocoding vs. Directions vs. Autocomplete), how often you call them per user action, and whether you're using patterns that trigger hidden costs
- Billing model fit — Whether the vendor's pricing structure (session-based, per-request, per-keystroke, flat free tier) aligns with your actual usage pattern
- Hidden cost structures — Search box keystroke billing, session billing on autocomplete, rate limiting incentives, and surprise price increases (like Mapbox's August 2025 event)
Only after you've answered those three questions does vendor selection matter.
The problem is that every comparison article in 2026 — including most of the ones updated in 2025 — either gets this backwards or misses it entirely. The most recent articles miss the Mapbox Search Box keystroke billing trap. Older articles use pre-2025 Google pricing. None of them explain why your architecture matters more than your vendor choice.
We're going to fix that.
Introducing the Map Cost Stack: three layers, in order
The Map Cost Stack is a three-layer decision model that actually determines your mapping costs:
Layer 1: request architecture
What does your app actually need to do? Which specific APIs are required, how many times per user action, and what's the monthly scale? This is where the real cost is determined — before any vendor pricing sheet enters the picture.
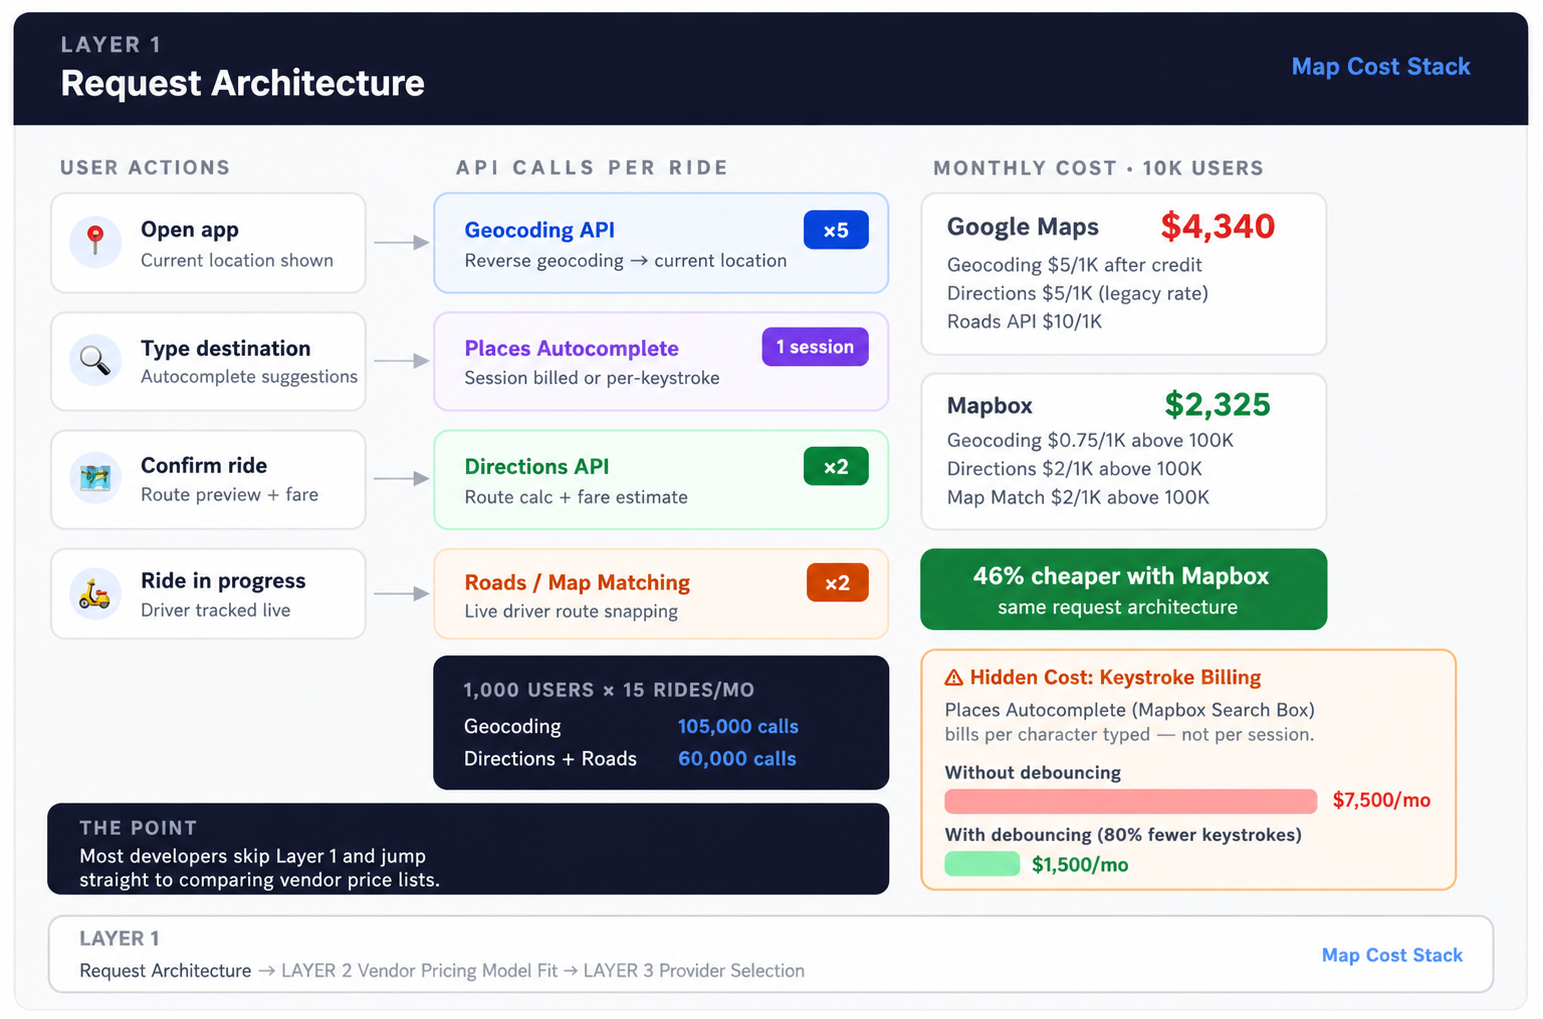
Example: A ride-sharing app needs Geocoding (reverse, for "pick up from current location"), Places Autocomplete (for destination entry), Directions (for route calculation), and Roads/Map Matching (for live driver tracking). That's a specific call pattern: ~5 Geocoding requests per ride, ~1 Places session (or 5+ individual requests), ~2 Directions calls, ~2 Roads API calls. At 1,000 users × 15 rides/month, that's a specific volume.
Hidden costs live here too. Mapbox Search Box uses keystroke-level billing: each character typed = a billable event. Without debouncing (waiting for the user to pause typing), 50 keystrokes per search × 1,000 daily active users = 50,000 billable events per day = ~$250/day in Search Box costs alone, or $7,500/month. With proper debouncing (reducing keystrokes by 80%), it's $1,500/month.
Most developers never do this analysis. They jump straight to Layer 3.
Layer 2: vendor pricing model fit
Now that you know what your app needs, which billing model matches? Session-based? Per-request? Per-keystroke? Flat free tier or tiered scaling?
Example: Google Maps charges $17 per Places Autocomplete session (you get one request per "search event"). Mapbox Search Box charges $0.005 per keystroke. For an app where a single user search = 1 Google session but 50 Mapbox keystrokes, the cost dynamics are inverted.
Google's March 2025 pricing restructure removed the $200/month universal credit and replaced it with per-SKU free caps. This fundamentally changed the math. Mapbox's August 2025 Search Box increase by 4x changed the math again.
Layer 3: provider selection
Finally — after you understand your architecture and know which billing models fit — compare the vendors. Features, coverage, visual customization, developer experience.
Most articles skip Layers 1 and 2 entirely and start here. That's why every conclusion reads "it depends on your use case" — because without understanding the first two layers, it genuinely does.
Layer 1: map your request architecture before touching a pricing page
Mapping APIs fall into categories. Your app probably doesn't need all of them.
Map Loads/Display (Static Maps, Dynamic Maps)
- What: Rendering the map tile layer on screen
- Cost sensitivity: Low for most apps (free tiers are generous)
- Hidden costs: None, straightforward per-request or per-load billing
Geocoding (Forward & Reverse)
- What: Convert addresses ↔ coordinates. "2 Lincoln Memorial Circle NW" = {lat: 38.899, lng: -77.050}
- Cost sensitivity: High for search-heavy apps; scale-dependent
- Hidden costs: Temporary vs. permanent geocoding pricing differs (permanent is more expensive)
Directions/Routing (Turn-by-turn, Route optimization)
- What: Calculate optimal routes, travel time, distance
- Cost sensitivity: High; costs scale with route complexity
- Hidden costs: None at the request level, but optimization libraries add cost
Places/Geocoding Autocomplete (Address search, Points of Interest)
- What: Real-time search suggestions as users type
- Cost sensitivity: High-cost zone. Billing can be per-session ($17/session on Google) or per-keystroke ($0.005/keystroke on Mapbox)
- Hidden costs: This is where Mapbox's August 2025 price increase hides. Without debouncing, keystroke-level billing inflates costs 10–20x.
Roads/Map Matching (Snap GPS coordinates to road network)
- What: Correct noisy GPS data to actual roads (critical for driver tracking in ride-sharing)
- Cost sensitivity: Medium; scales with vehicle count
- Hidden costs: None
Traffic/Real-time Data (Current conditions, historical patterns)
- What: Show current congestion, incident alerts, traffic-informed routing
- Cost sensitivity: Low if you use it sparingly; expensive at scale
- Hidden costs: Usually included in routing costs, not separate
Now map your app's actual user flows:
Gokada example (Brocoders client): ride-sharing request architecture
Rider Flow (5 API calls per ride):
- User opens app → Map Load (free or minimal cost)
- User enters destination with autocomplete → Places Autocomplete (1 session or 5 keystrokes)
- User confirms pickup location → Reverse Geocoding (1 call)
- Driver assigned, route shown → Directions API (1 call)
- Live tracking → No additional API calls (map updates use tiles, not API)
Driver Flow (4 API calls per ride):
- Driver accepts ride → Reverse Geocoding for current location (1 call)
- Route to pickup shown → Directions API (1 call)
- Real-time tracking as driver moves → Map Matching / Roads API (1 call per location update, but usually batched)
- Dropoff routing → Directions API (1 call)
Per ride per user: ~5 Geocoding, ~1 Places session (or 5+ Mapbox keystrokes), ~2 Directions, ~2 Map Matching
At 1,000 active users making 15 rides/month:
- Total Geocoding: 105,000
- Total Places Autocomplete: 15,000 sessions (or 75,000 Mapbox keystrokes)
- Total Directions: 30,000
- Total Map Matching: 30,000
Scale to 10,000 users:
- Geocoding: 1,050,000
- Places: 150,000 sessions
- Directions: 300,000
- Map Matching: 300,000
This is Layer 1. No vendor selected yet. But your cost is already roughly determined.
Layer 2: match the billing model to your request pattern
Now look at how vendors price these volumes.
Google Maps (post-March 2025 restructure)
What changed: The $200/month universal credit is gone. Replaced with per-SKU free caps.
- Maps/Tiles: ~28,500 free loads/month on Essentials tier; overage $7/1,000 (up from $2)
- Geocoding: Included in tier; 100K free on Essentials; $5/1,000 overage
- Directions: Included in tier; 100K free on Essentials; $5/1,000 overage
- Places Autocomplete: Session-based: $17/session (1,000 free); Per-request: $0.29/request (1,000 free)
- Subscription Plans: Starter $100/mo, Essentials $275/mo (better for multi-API use), Pro $1,200/mo
For a 10,000-user ride-sharing app (1.05M Geocoding, 150K Places sessions, 300K Directions):
- Old pricing (with $200 credit): ~$300/month
- New pricing (per-SKU): ~$500–700/month without subscription; cheaper with subscription if volume is steady
Pros: Session-based Places billing is predictable; subscriptions offer discounts
Cons: Per-SKU caps penalize diverse API usage; legacy APIs (Directions, Distance Matrix) officially deprecated; migration required
Mapbox (2026 core + August 2025 Search Box trap)
Core APIs:
- Maps/Tiles: 50,000 free loads/month; overage $5/1,000 (dropping to $3/1,000 at 200K+)
- Geocoding: Included free; no per-query cost in free tier
- Directions: 100,000 free/month; overage $2/1,000 (dropping to $1.20/1,000 at 1M+)
- Temporary Geocoding: 100,000 free; $0.50/1,000 overage
For the same 10,000-user app (core APIs only):
- At 10,000 users: Within or near free tier for most APIs; cost ~$200–400/month if directions overage
But then there's Search Box.
Mapbox Search Box (August 2025 pricing change):
- Price increase: ~4x from previous pricing
- Billing: $0.005 per keystroke
- Actual cost: $0.005/keystroke (roughly $5 per 1,000 keystrokes)
Without debouncing (user types destination, 50 keystrokes):
- 1,000 daily active users = 50,000 keystrokes/day = ~$250/day = ~$7,500/month
- For a ride-sharing app already paying ~$300/month for core APIs, Search Box adds $7,500/month in hidden costs
With aggressive debouncing (80% reduction through delayed requests):
- Same scenario = $1,500/month
- Still material, but sustainable
The catch: Debouncing is a development best practice that requires code implementation. Many teams build autocomplete without it initially, then get surprised by the bill.
HERE Maps (250,000 free transactions/month)
- Most generous free tier in the market
- Transactions = any API call (maps, geocoding, routing, etc.)
- Overage: ~$4/1,000 for most APIs
- Backed by automotive industry; strong enterprise positioning
For 10,000-user app:
- All volumes under free tier cap
- Cost: $0 for months where total calls < 250,000
OpenStreetMap (free API, not-free infrastructure)
- OSM API: Free, no requests metering
- Routing (OSRM, Valhalla, GraphHopper): Free or self-hosted
- Tile Server: 800GB+ data storage, $2,000–5,000/month infrastructure for self-hosted global deployment
The "free" label is misleading. You're paying in DevOps complexity, not API bills. For Gokada, using OSM-based services for certain parts of the app (fallback routing, offline maps) made sense. As a primary provider at their scale, the infrastructure cost would exceed Mapbox's bill.
Layer 3: now compare the vendors
Google Maps
Best for: Apps needing global coverage, extensive Points of Interest data, predictable pricing via subscriptions
Strengths:
- 99% global coverage
- Richest Places data (business listings, photos, reviews)
- Session-based Places pricing is predictable
- Subscriptions offer multi-API bundling and discounts
- Well-documented legacy APIs (though officially deprecated)
Weaknesses:
- Per-SKU free caps penalize diverse API usage
- Pricing increases are unpredictable (2018: 1,400% increase; 2025: restructure)
- Legacy APIs officially deprecated; migration overhead
- Higher per-request costs for single APIs when used alone
Mapbox
Best for: Startups and early-scale apps with generous free tiers; apps with visual customization demands; apps avoiding Google's unpredictability
Strengths:
- 50,000 free map loads/month + 100,000 free directions = generous free tier
- Mapbox Studio = best-in-class visual customization
- Lower per-request pricing on core APIs once free tier exceeded
- Developer experience is strong; excellent documentation
Weaknesses:
- Search Box keystroke billing is a major hidden cost if autocomplete not properly debounced
- Weaker Points of Interest coverage outside North America/Europe
- August 2025 price increase on Search Box caught many teams off-guard
- Billing complexity (per-service free tiers + keystroke billing on Search Box)
OpenStreetMap (+ MapLibre GL JS)
Best for: Apps requiring data ownership, offline capabilities, community-driven data; privacy-conscious teams; open-source development
Strengths:
- Free API with no metering
- Community-driven data ownership
- Can be edited and customized
- MapLibre GL JS = free, open-source rendering (post-2021 Mapbox fork)
Weaknesses:
- Sparse coverage in rural/developing regions
- No routing API; must use third-party services
- Infrastructure cost for self-hosting rivals Mapbox pricing
- Data quality inconsistent by region
- Requires more development overhead
MapLibre GL JS (the overlooked option)
Free, open-source fork of Mapbox GL JS (after Mapbox changed its license in 2021). Enables Mapbox-quality visual rendering without Mapbox API billing.
Works with any tile source (OSM, Mapbox, Stadia Maps, custom). Increasingly adopted by Maptiler, Felt, Stadia Maps.
Best for: Teams wanting Mapbox-quality rendering without Mapbox cost exposure; privacy-conscious apps; open-source-first projects
Trade-off: Requires self-hosting tiles or using a third-party tile service (which may introduce new costs), but avoids being locked into Mapbox's pricing changes.
HERE Maps
250,000 free transactions/month makes HERE's free tier the highest in the industry. Strong for enterprise positioning (backed by BMW, Audi, Mercedes).
Best for: Enterprises already on HERE; automotive/logistics apps; teams needing cost predictability; startups that want to avoid vendor lock-in
Weakness: Less developer mindshare than Google/Mapbox; documentation and SDKs improving but not yet as comprehensive.
Emerging alternatives (2026)
Radar. Developer-focused location platform; strong positioning for startups concerned about pricing lock-in. Growing in "Mapbox alternative" searches.
Azure Maps. Part of Microsoft ecosystem; appeals to enterprises on Azure. Growing presence in enterprise comparisons.
Woosmap. European alternative with cost-predictability focus; visible in 2026 comparisons.
These are worth considering if your use case aligns with their positioning, but they're not yet mature enough to be defaults.
What Google's March 2025 pricing change actually means
In March 2025, Google fundamentally restructured its pricing:
Removed: The $200/month universal credit that had applied across all APIs
Added: Per-SKU free caps (different free limits for different APIs) and subscription plans
What this means:
Before 2025: You got $200 credit. Once you exceeded one SKU's free limit, the credit covered additional usage across all APIs.
Example: 100K Geocoding calls + 50K Directions calls = $200 credit covered most costs.
After 2025: Each SKU has its own free cap. The Essentials tier ($275/mo) covers 100K of one API. Additional APIs incur full overage costs.
Same example: 100K Geocoding (free on Essentials) + 50K Directions (overage = $250) = $250/month vs. $0 with the old credit.
Who this hurts: Apps using diverse, moderate-volume APIs (the Gokada pattern: geocoding + directions + places all needed, none massive on its own)
Who this helps: Apps using a single high-volume API (pure routing platform, for example)
Migration required: Directions API and Distance Matrix API are officially deprecated. Developers must migrate to Routes API (distance-based pricing, $0.005/km) and Places API (New).
The Routes API pricing model is different enough that migration involves code changes, not just billing plan updates.
The Mapbox Search Box trap: why keystroke billing can cost 10–20x more than you think
This is the single biggest hidden cost in the mapping API market right now, and it's virtually absent from all comparison articles.
In August 2025, Mapbox increased Search Box pricing by ~4x and changed the billing model from "per completed search" to "per keystroke typed."
How keystroke billing works
Every character typed in a search field = one billable event at $0.005/keystroke.
A user typing "123 Main St" = 11 characters = $0.055 per search.
A user typing "San Francisco" = 13 characters = $0.065 per search.
Without debouncing (immediately sending API requests as the user types):
- User makes 1 search = 50 keystrokes average = $0.25/search
- 1,000 daily active users = 50,000 keystrokes/day = $250/day = ~$7,500/month
With debouncing (waiting 300ms after the user stops typing to send the request):
- API calls per user drop 80% → 10 keystrokes per search = $0.05/search
- Same 1,000 DAU = 10,000 keystrokes/day = $50/day = ~$1,500/month
The difference: $6,000/month for a single implementation detail.
Why this matters
In a ride-sharing app like Gokada:
- Core APIs (Geocoding, Directions) cost ~$2,325/month at 10K users
- Search Box without debouncing adds ~$7,500/month
- Total: ~$10,000/month (Mapbox is now 4x more expensive than Google for this pattern)
- Search Box with debouncing: ~$1,500/month additional (sustainable)
Most teams building autocomplete don't implement debouncing initially. They either:
- Find out about the cost when the bill arrives
- Never notice (low-volume app)
- Implement debouncing retroactively (code change)
No competing comparison article surfaces this risk. This is Brocoders' clearest competitive advantage for this article.
The Gokada case: running the numbers for real
We built Gokada, a motorbike ride-sharing app in Nigeria, and documented the exact API call pattern and costs at different scales. This is the only real-world cost comparison data available in the entire competitive landscape.
The request architecture
User initiates a ride:
- Opens app → Map Load (free)
- Enters destination → Places Autocomplete, 1 session (Google) or 50 keystrokes (Mapbox)
- Location pinned → Reverse Geocoding (1 call)
- Route displayed → Directions API (1 call)
- Live tracking → Map tiles only (no additional API calls)
Driver accepts ride:
- Pickup location shown → Reverse Geocoding (1 call)
- Route to pickup → Directions API (1 call)
- Real-time tracking → Roads/Map Matching API for live location snapping (batched requests)
- Dropoff routing → Directions API (1 call)
Per ride, per user:
- Geocoding: 5 calls
- Places Autocomplete: 1 session (or 50 Mapbox keystrokes if not debounced; 10 if debounced)
- Directions: 2 calls
- Roads/Map Matching: 2 calls

Scaling the numbers
At 1,000 active users (15 rides/user/month):
- Geocoding: 105,000 calls
- Places: 15,000 sessions (or 750,000 Mapbox keystrokes)
- Directions: 30,000 calls
- Roads: 30,000 calls
At 10,000 users:
- Geocoding: 1,050,000
- Places: 150,000 sessions
- Directions: 300,000
- Roads: 300,000
Cost comparison
| Metric | 1,000 Users | 10,000 Users |
|---|---|---|
| Google Maps (core APIs) | ~$367/month | ~$4,340/month |
| Mapbox (core APIs) | $0 (within free tier) | ~$2,325/month |
| Mapbox (+ Search Box, no debouncing) | ~$450/month | ~$5,800/month |
| Mapbox (+ Search Box, with debouncing) | ~$100/month | ~$3,825/month |
Key insight: Mapbox's lower core API pricing (46% savings) is completely negated by Search Box keystroke billing if autocomplete isn't properly implemented.
The Gokada team's solution: use Mapbox for core APIs where pricing was competitive, and use OSM-based services (OSRM for routing fallback, offline tiles) for specific high-cost scenarios.
How to choose: the 4-question decision framework
Use this framework to work through Layers 1, 2, and 3:
Question 1: what APIs does your use case actually require?
List the specific APIs your app will call:
- Maps/Tiles (required for display)
- Geocoding (required for address search)
- Directions/Routing (required for routing)
- Places Autocomplete (required for search)
- Traffic (required for real-time conditions)
- Other
For each, estimate: calls per user per session, expected monthly scale at your target growth.
Critical: If you're using autocomplete, commit to debouncing in your architecture. This single detail changes your actual cost by 10x.
Question 2: which billing model aligns with your architecture?
- Google's session-based Places: Best for apps with low search frequency (a handful of searches per session)
- Mapbox's per-keystroke Search Box: Only viable with aggressive debouncing (300ms, 80%+ reduction)
- Google's per-SKU free caps + subscriptions: Best if you're using a diverse mix of APIs in moderate volumes
- Mapbox's flat per-service free tiers: Best if you have a single dominant API (e.g., pure routing)
- HERE's transaction model: Best if you want predictability (every API counts as one transaction)
Example: If your app is geocoding-heavy and routing-light, Mapbox's 100K free directions + per-request pricing is better than Google's tiers. If your app is Places-heavy, Google's session pricing is better.
Question 3: what's your geographic coverage need?
- Global coverage: Google Maps (99% coverage)
- North America / Western Europe: Mapbox (strong coverage)
- Specific region (Nigeria, Southeast Asia, etc.): Validate with Mapbox, HERE, or OSM before committing
- Open data requirement: OpenStreetMap
Question 4: which vendor matches your Layer 1 + 2 analysis?
Now, and only now, compare vendors based on your actual request pattern.
Cost comparison tables (2026 updated)
Vendor pricing by API type
| API Type | Google Maps | Mapbox | HERE Maps | Azure Maps |
|---|---|---|---|---|
| Maps/Tiles | $7.00/1K overage (after ~28.5K free) | $5.00/1K ($3.00/1K at 200K+) | ~$4.00/1K | ~$5.50/1K |
| Geocoding | $5.00/1K | $0.50/1K | ~$3.00/1K | ~$4.00/1K |
| Directions/Routes | $0.005/km (Routes API) | $2.00/1K ($1.20/1K at 1M+) | ~$3.00/1K | ~$2.50/1K |
| Places Autocomplete | $17/session or $0.29/request | $0.005/keystroke (Aug 2025 increase) | ~$2.00/1K | ~$3.00/1K |
| Search Box (no debouncing) | N/A | $7,500/month at 1K DAU | N/A | N/A |
| Search Box (with debouncing) | N/A | $1,500/month at 1K DAU | N/A | N/A |
Free tier comparison
| Vendor | Maps | Geocoding | Directions | Autocomplete | Value |
|---|---|---|---|---|---|
| 28.5K/mo | Included | Included | 1K sessions | ~$400/mo equiv. | |
| Mapbox | 50K/mo | Free | 100K/mo | $0 for Search Box | ~$3K-5K/mo equiv. |
| HERE | 250K transactions/mo across all | Included | Included | Included | ~$10K+/mo equiv. |
Ride-sharing app cost at scale
| Scale | Geocoding Calls | Places Calls | Directions Calls | Google Cost | Mapbox Cost (core) | Mapbox Cost (+ Search Box, debounced) |
|---|---|---|---|---|---|---|
| 1,000 users | 105K | 15K | 30K | ~$367 | ~$0 | ~$100 |
| 10,000 users | 1.05M | 150K | 300K | ~$4,340 | ~$2,325 | ~$3,825 |
Bottom line: At 10,000 users, Mapbox's core APIs are 46% cheaper than Google. If Search Box is added without debouncing, Mapbox becomes 30% more expensive.
Choosing your architecture: when each vendor wins
| App Type | Best Choice | Why |
|---|---|---|
| Ride-sharing | Mapbox (core) + Google (Places if no autocomplete) or Mapbox (with aggressive debouncing) | Mapbox's directions pricing is unbeatable; Places autocomplete decision depends on scale |
| Delivery/logistics | Mapbox (core) or Google Essentials subscription | Routing is the cost driver; both competitive |
| Real estate / property search | Google (Places session pricing) or Mapbox (if low autocomplete volume) | Search autocomplete is high-volume; Google's session model is more predictable |
| Field service / route optimization | Google Routes API or Mapbox Directions | Routing is dominant; cost difference minimal |
| Low-volume startup (MVP) | Mapbox or HERE | Generous free tiers; Mapbox preferred if developer experience matters |
| Enterprise (high volume) | Google subscription plans or HERE | Predictability > raw price; support matters |
| Open-source / data ownership | MapLibre GL JS + self-hosted routing or MapLibre + Stadia Maps tiles | Control over data and rendering; accept infrastructure overhead |
Summary: the decision path
- Map your request architecture (which APIs, how many calls per user, at what scale)
- Choose your billing model (which structure fits your architecture, including debouncing if using autocomplete)
- Validate coverage (can this vendor cover your geography?)
- Compare vendors (now that you know what you actually need)
The real decision driver in 2026 is aligning vendor billing model to your architecture. The vendor you pick matters, but the calls you architect matter more.
If you're building a location-based app and want to understand the right architecture before you start, Brocoders has built and optimized multiple location-heavy products: Gokada (ride-sharing), Korobox (delivery), Revenue Boosters (route management SaaS). We can help you map the cost architecture and avoid the hidden cost traps.
Read the full Gokada case study →
Related reading
- How to Create an Uber-Like App: Challenges and Solutions
- 6 Challenges We Faced While Developing a Bike-Sharing App
- Ride-Sharing & On-Demand App Development
- MVP Development Services
Article updated April 2026. Incorporates Google's March 2025 pricing restructure, Mapbox's August 2025 Search Box keystroke billing trap, MapLibre GL JS ecosystem, and emerging alternatives (Radar, Azure Maps, Woosmap).
FAQ
Depends on your request pattern, but for a typical app making 100K Geocoding + 50K Directions + 15K Places calls per month: $200–500/month with Essentials subscription or pay-as-you-go, versus $0 if you stay within free tier limits.
For core APIs (maps, geocoding, directions): Yes, ~46% cheaper at scale. But if you need autocomplete without proper debouncing, Mapbox's Search Box keystroke billing can make it 30% more expensive overall.
The August 2025 pricing increase introduced keystroke-level billing at $0.005/keystroke, creating a 10–20x cost difference depending on implementation. Without debouncing, it's a budget killer. With debouncing, it's sustainable.
MapLibre GL JS is the free, open-source fork of Mapbox GL JS (created after Mapbox changed its license in 2021). It provides Mapbox-quality visual rendering without any Mapbox API billing. You can use it with any tile source (OSM, Mapbox, Stadia Maps, etc.).
Google removed the $200/month universal credit and replaced it with per-SKU free caps and subscription plans. This hurts apps using diverse, moderate-volume APIs and helps apps with a single dominant API.
The API is free to use. But the infrastructure cost of self-hosting OSM tiles + routing globally is $2,000–5,000/month. So "free" is misleading — you're paying in DevOps costs, not API fees.
If you can implement debouncing properly: Mapbox (generous free tier on core APIs). If you need autocomplete reliability without implementation complexity: Google's Essentials subscription ($275/mo) offers predictability. If you want maximum free tier value: HERE Maps (250K transactions/mo).
These are growing in SERP but not yet mature enough to be defaults. Consider them if your use case aligns: Radar for startups wanting vendor-neutral positioning, Azure for Microsoft-heavy enterprises, Woosmap for cost predictability focus.
- List every API your app will call (geocoding, directions, autocomplete, etc.)
- Estimate calls per user per session
- Project your target user scale at 6, 12, and 24 months
- Multiply by vendor pricing
- If using autocomplete, assume debouncing (80% call reduction) from day one